goRubu
This repo contains implementation of a Url Shortner written in Go.

![]()


Contents
- What is goRubu?
- Why goRubu?
- BenchMarking
- Running Server
- Api’s
- Monitoring
- Contributing
- Future Todo
- Maintainer
- License
What is goRubu? :rocket:
- A Url Shortner written in Go, with MongoDb based backend.
- Supports Caching for Hot urls, with Memcached, using a LRU based eviction strategy, and write through type of caching mechanism. Saw 200% decrease in Read Latency for URL redirection, after caching.
- Used Travis CI for adding a CI/CD pipeline.
- Dockerized the whole application. Used Docker compose for tying up different containers and multi-stage build for reducing the size of docker image by 900%.
- Prometheus and Grafana based monitoring, to get an overall picture of the system and application metrics.
- Handled Concurrent Requests, using a global Mutex, over Request Level. Use Optimistic Concurrency Control and Pessimistic Concurrency Control, to see if Performance can be increased.
- Contains Api Validation and Logging Middlewares, along with Swagger based documentation
Why goRubu? :dog:
Wanted to Learn Go and system design, by building a project. Hence goRubu.
BenchMarking
NOTE - Url Shortner is a read heavy system (read:write = 100:1), and these load tests are done on a single Machine (8Gb Ram, i5 Processor).
Check this out for more info.
- For Url Redirection, with 1000 Concurrent Users, bombarding the app server for 2mins:
http_req_duration..........: avg=2.39s min=0s med=2.27s max=7.51s p(90)=3.65s p(95)=4.16s http_reqs..................: 49587 413.224692/s - For Url Shortening, for same specs
http_req_duration..........: avg=8.6s     min=0s      med=8.6s  max=19.03s   p(90)=10.33s p(95)=10.69s
http_reqs..................: 13345   111.207074/s
Running Server :gear:
Docker
- You need to have docker and docker-compose installed. After that just do
git clone https://github.com/rv404674/goRubu.git
cd goRubu
make docker
Note - I haven’t dockerized prometheus and grafana with it. Containerized goRubu and locally installed prometheus and grafana will work fine as prometheus is only listening to “local:8080/metrics”.
Check the Api’s Section afterwards.
Local
Prerequisites ✅
Ensure you have the following installed. Mongodb Memcached Make
On Macos, simply use thse
$ brew update
$ brew install mongodb/brew/mongodb-community
$ brew install memcached
$ brew install make
Note: After that check whether these have been started, else you will get connection error.
$ brew services list
if any service is not up do
$ brew service start service_name
Then we need to download the tar files for prometheus, grafana and node exporter. We will need to edit their config files, hence we are not using brew install for these. Also it becomes easy to run the server and do changes.
For Grafana
wget https://dl.grafana.com/oss/release/grafana-6.7.3.darwin-amd64.tar.gz
tar -zxvf grafana-6.7.3.darwin-amd64.tar.gz
mv grafana-6.7.3 /usr/local/bin
cd /usr/local/bin/grafana-6.7.3/bin
./grafana-server # this will run the grafana server
Note - By default prometheus server runs on 9090, and grafana on 3000.
Similarly download tar files for prometheus and node exporter and run there servers as well.
Step to Run locally
-
Go to the dir where prometheus is installed and change the prometheus default .yml file to this one new_yml, run the prometheus server, and node_exporter server.
- do
$git clone https://github.com/rv404674/goRubu.git - cd in goRubu, and do
make depsIt will install all the go dependencies.
- Then do
make install make executeNote: To see what these commands do check out this makefile
Api’s :computer:
- Hit localhost:8080/all/shorten_url with any url as key.
{
 "Url": "https://www.redditgifts.com/exchanges/manage"
}
The endpoint will return a shortened URL.
- Hit http://localhost:8080/all/redirect with the shortened url to get the original URL back.
{
 "Url": "https://goRubu/MTAxMTA="
}
Monitoring :microscope:
Working:
- Prometheus follows a Pull based Mechanism instead of Push Based.
- goRubu exposes an HTTP endpoint exposing monitoring metrics.
- Prometheus then periodically download the metrics. For UI, prometheus is used as a data source for Grafana.
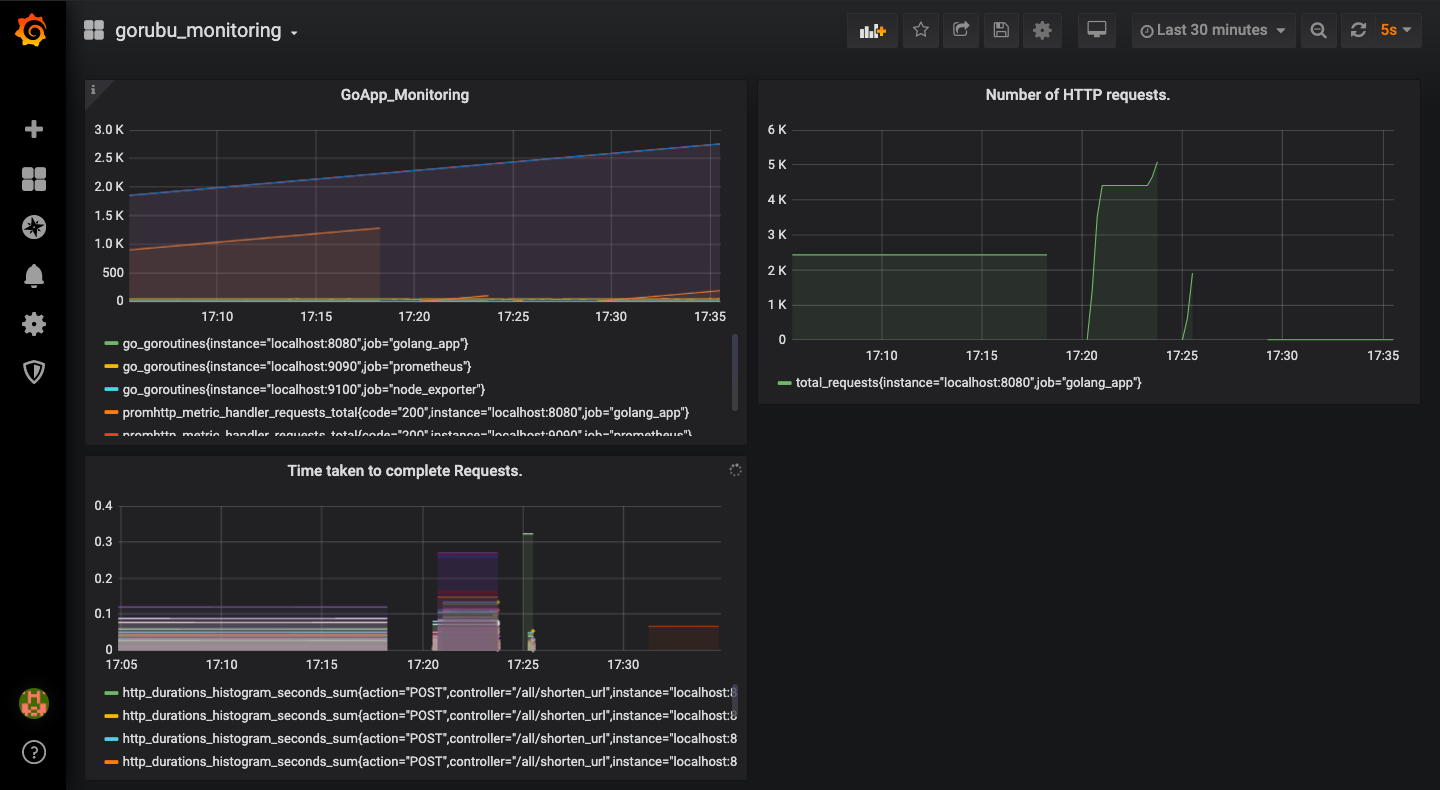
Grafana on Top of Prometheus
Contributing :beers:
Peformance Improvements, bug fixes, better design approaches are welcome. Please Discuss your change by raising an issue, beforehand.
Future Todo :notebook:
- Use Promtheus and Grafana as Docker Containers instead of Local Installation.
- Use Kubernetes instead of Docker Compose.
- Increase Coverage to more than 90%.
- Add Monitoring in Prometheus for Number of 2xx, 3xx and 4xx.
Maintainer :sunglasses:
License :scroll:
MIT © Rahul Verma